Documentation
Generate detailed analytics reports for your advertising campaigns with customizable data columns and flexible filtering options.
The DSP Reports feature provides comprehensive analytics for your advertising campaigns. Generate detailed Excel reports with customizable data columns, date ranges, and filtering options to gain valuable insights and optimize your campaign performance.
Available Report Types
Choose from seven specialized report types, each designed for specific analytical needs:
- Delivery Analytics: Track campaign reach, impressions, clicks, and overall delivery performance with hourly or daily granularity
- Site Domain Performance: Analyze how your campaigns perform across different websites, mobile apps, and publishers
- Geo Analytics: Understand geographical performance by country, region, and city to optimize location targeting
- Video Analytics: Monitor video-specific metrics including completion rates, view times, and engagement
- Segment Performance: Evaluate audience segment effectiveness and targeting accuracy
- Devices & Frequency: Analyze device performance and impression frequency across your campaigns
- Attributed Conversions: Track conversion events and attribution paths for campaign optimization

Key Benefits
✅ Excel Format: All reports are delivered as downloadable Excel files for easy analysis and sharing
✅ Customizable Columns: Select only the data points you need from dozens of available metrics
✅ Email Delivery: Reports are sent directly to your email inbox upon completion
✅ Flexible Date Ranges: Generate reports for any custom date range or use quick presets
✅ Campaign Filtering: Focus on specific campaigns or analyze all campaigns for an advertiser
How to Generate Reports
Step 1: Access the Reporting Section
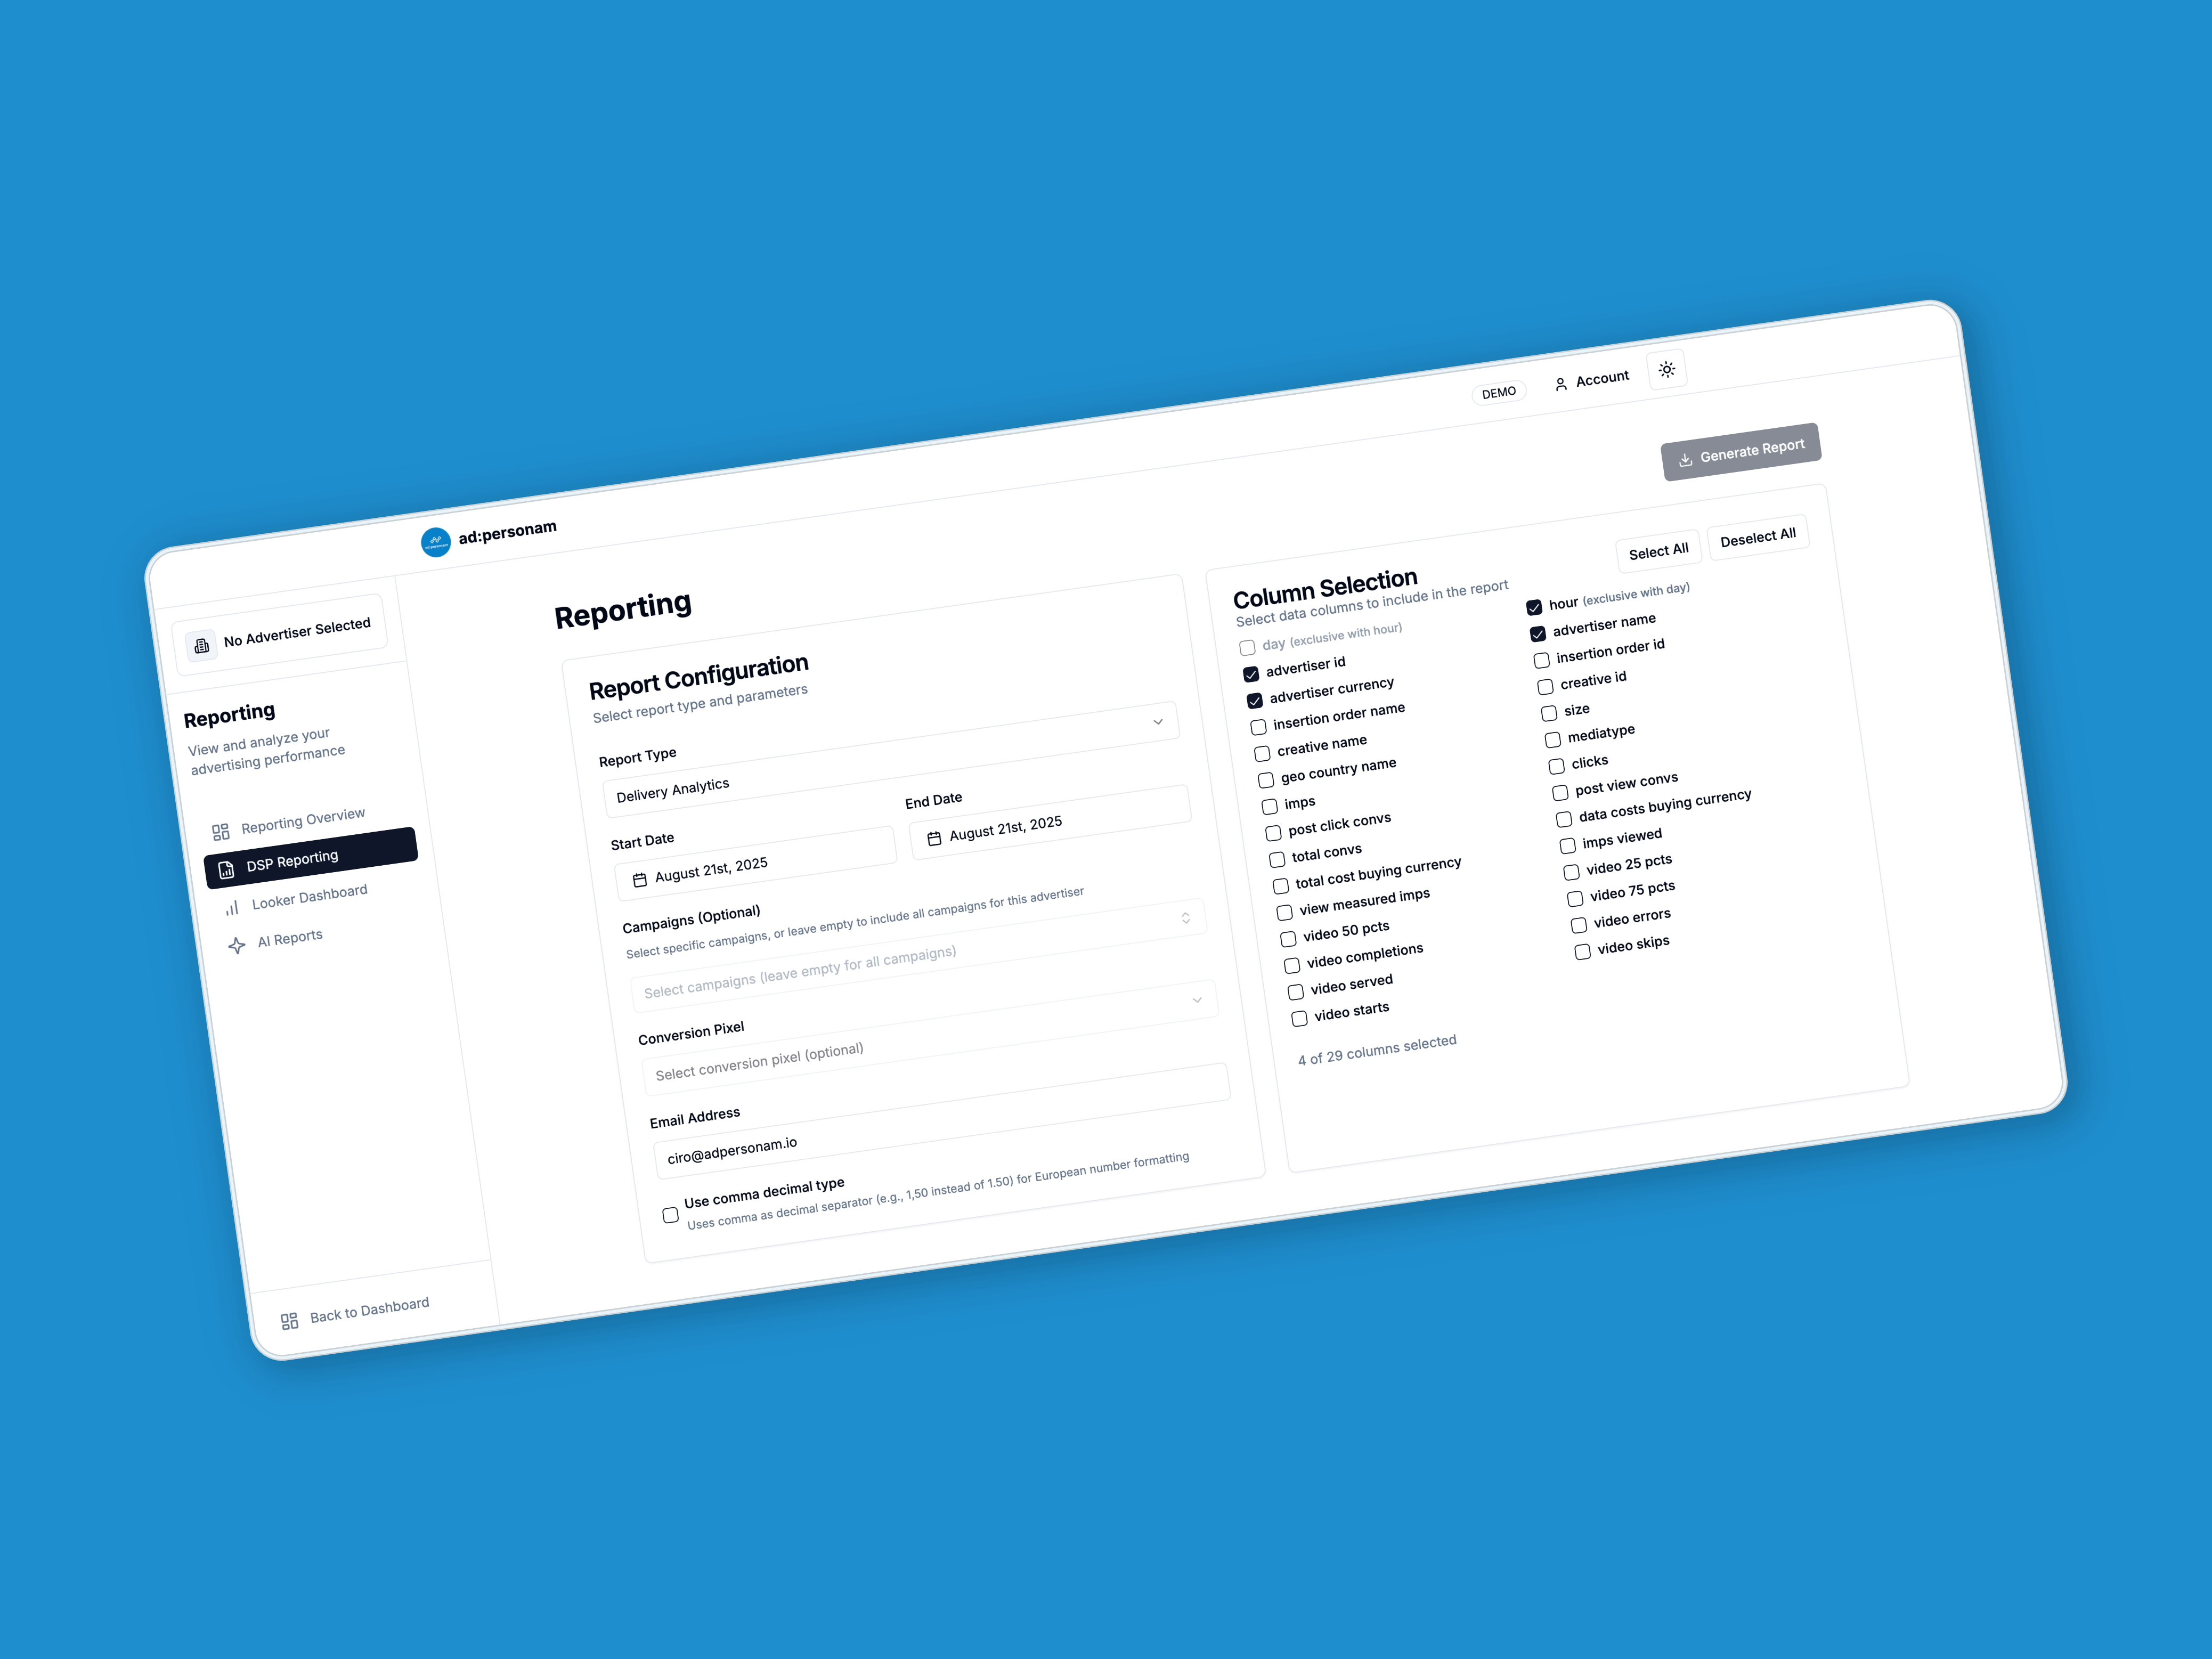
Navigate to the Reporting page from your dashboard. You'll see two main sections: Report Configuration and Column Selection.
Step 2: Configure Your Report
Select Report Type: Choose from the dropdown menu which type of analytics you need. Each report type offers different metrics and insights.
Set Date Range:
- Pick your start and end dates using the date pickers
- You can select any custom date range for historical analysis
- Both dates are required to generate a report
Choose Campaigns (Optional):
- Select specific campaigns to analyze, or leave empty to include all campaigns
- Use the multi-select dropdown to choose multiple campaigns
- This helps focus your analysis on particular campaign performance
Select Conversion Pixel (Optional):
- Available for Delivery Analytics, Site Domain Performance, and Geo Analytics reports
- Choose a conversion pixel to filter data related to specific conversion tracking
- Select "None" if you don't want to filter by conversion pixels
Step 3: Configure Report Settings
Email Address:
- Your email is automatically populated from your profile
- You can change it if you want the report sent to a different address
- The report will be delivered to this email once processing is complete
Number Format:
- Choose between decimal point (1.50) or comma decimal (1,50) formatting
- Comma decimal is useful for European number formatting standards
Step 4: Select Data Columns
Choose Your Metrics:
- Select which data columns to include in your report from the available options
- Each report type offers different metrics relevant to that analysis
- You must select at least one column to generate a report
Column Selection Tips:
- Use "Select All" to include all available metrics
- Use "Deselect All" to start fresh with column selection
- For Delivery Analytics reports, you can choose either hourly or daily granularity, but not both
Step 5: Generate Your Report
Click the Generate Report button to create and send your report. The system will:
- Validate that all required fields are completed
- Process your request and generate the Excel file
- Send the completed report to your specified email address
- Display a confirmation message with details about your request
Note: Report generation typically takes a few minutes depending on the data volume and date range selected.
Understanding Your Report Data
Each report type provides specific metrics tailored to different aspects of campaign analysis:
Delivery Analytics
Includes campaign identifiers, creative details, geographical data, impressions, clicks, conversions, costs, viewability metrics, and video performance data. Choose between hourly or daily time granularity for detailed performance tracking.
Site Domain Performance
Provides daily performance data broken down by website domains, mobile applications, seller information, operating system families, and supply types. Perfect for identifying top-performing publisher relationships.
Geo Analytics
Offers geographical performance breakdowns by country, region, and city, along with standard campaign metrics. Essential for understanding regional campaign effectiveness and optimizing geo-targeting.
Video Analytics
Focuses on video-specific engagement metrics including completion rates, view times, starts, skips, and interaction data. Ideal for optimizing video creative performance and placement strategies.
Segment Performance
Evaluates audience segment effectiveness with performance metrics specific to each targeted segment. Helps refine audience targeting and improve campaign precision.
Devices & Frequency
Analyzes device types, media formats, frequency capping effectiveness, and estimated unique user reach. Useful for understanding audience overlap and optimizing frequency strategies.
Attributed Conversions
Tracks detailed conversion events with attribution data, including conversion timestamps, order IDs, and traffic types. Critical for understanding conversion paths and attribution modeling.
Tips for Effective Reporting
💡 Start with Overview Reports: Use Delivery Analytics for general campaign performance, then drill down with specialized reports
💡 Compare Time Periods: Generate reports for different date ranges to identify trends and seasonal patterns
💡 Focus Your Analysis: Select specific campaigns and relevant columns to keep reports manageable and actionable
💡 Regular Monitoring: Set up recurring reports for ongoing campaign optimization and performance tracking
For more detailed information about campaign setup and optimization, visit our Campaign Setup Guide.